
 |
 |
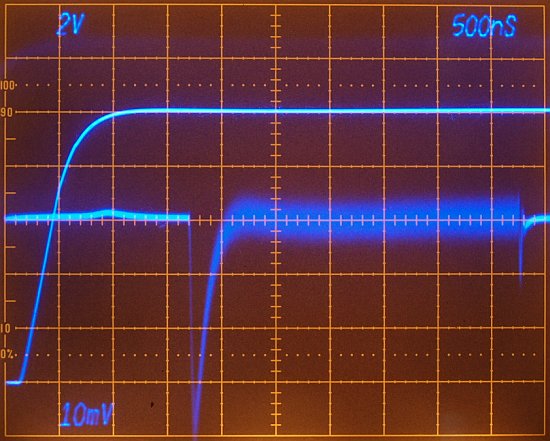
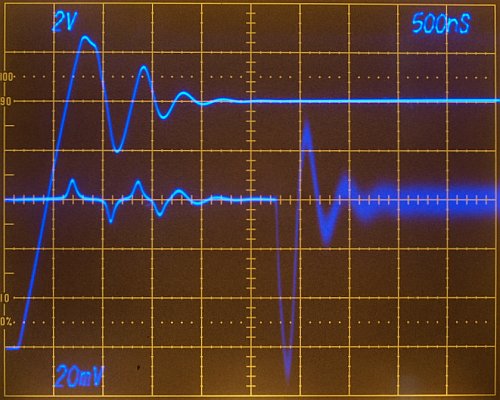
| Left: DAC xxxx with amplifier xxxx Top Trace DAC Output 2V/div, 0V to +10V Full Scale Step Bottom Trace Gated Settling 10mV/div, 250µV/div on Settle Node This is a compensation with a flat aperiodic response. |
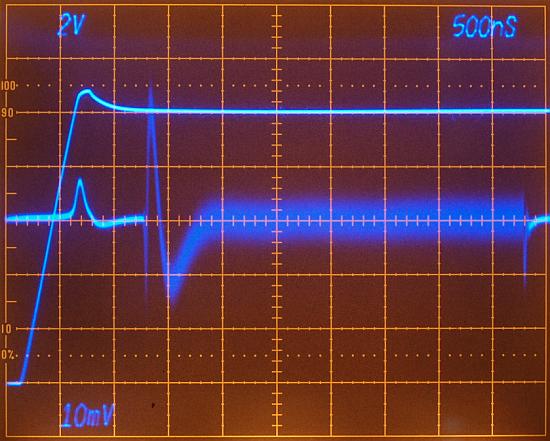
Left: DAC xxxx with amplifier xxxx Top Trace DAC Output 2V/div, 0V to +10V Full Scale Step Bottom Trace Gated Settling 10mV/div, 250µV/div on Settle Node This is the fastest possible compensation with a flat response but overshooting appr. 1V |
 |
 |
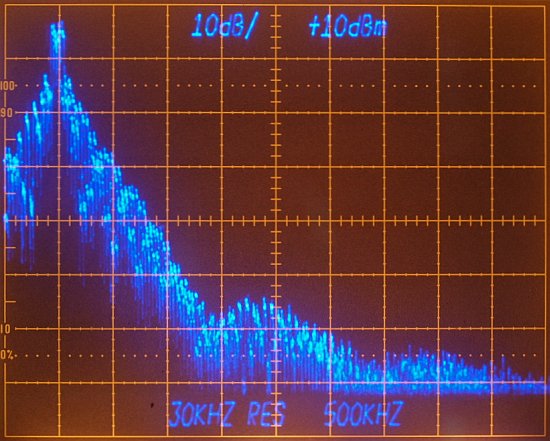
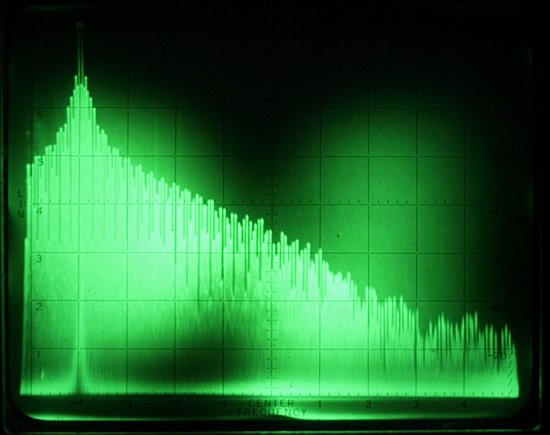
| Left: spectrum when compensated for an aperiodic step response 0V to +10V 500kHz/div Bandwidth 30kHz Less frequency contents (above 3MHz) |
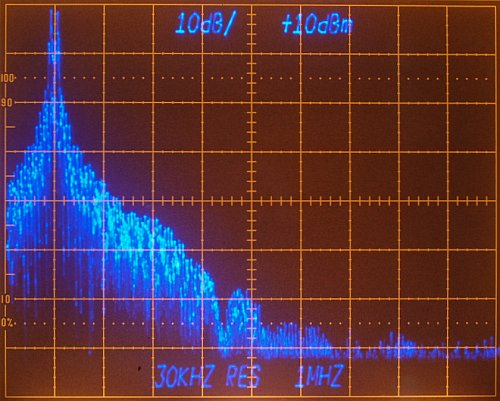
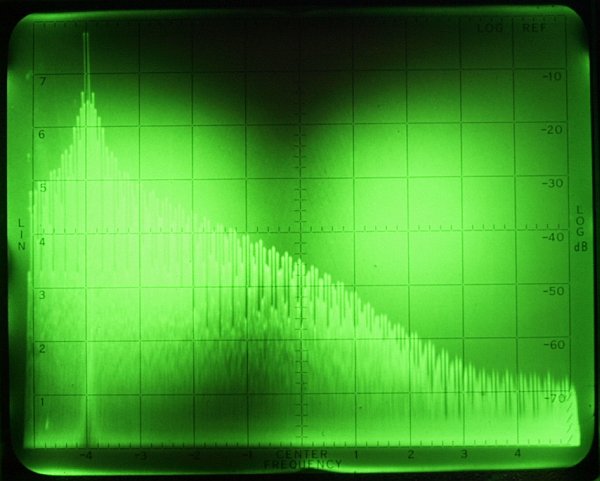
Right: spectrum when compensated with 1V overshooting whit a 0V to +10V step 500kHz/div Bandwidth 30kHz The spectrum is very smeared. |

| left photo: DAC xxxx with amplifier xxxx DAC Output 5V/div - 10V to +10V Full Scale Step Gated Settling 20mV/div - 500µV/div on Settle Node Compensation for a almost flat aperiodic response. right photo: Spectrum when compensated for an aperiodic step response -10V to +10V 500kHz/div Bandwidth 30kHz |


|
The aperiodic adjusted compensation will lead to nice roll-off of
the amplifier gain. The overshooted CRT photo right shows also again
with a standard oscillosscope you are blind, the damped ringing takes 8
Division to reach a stable 16 Bit level. |
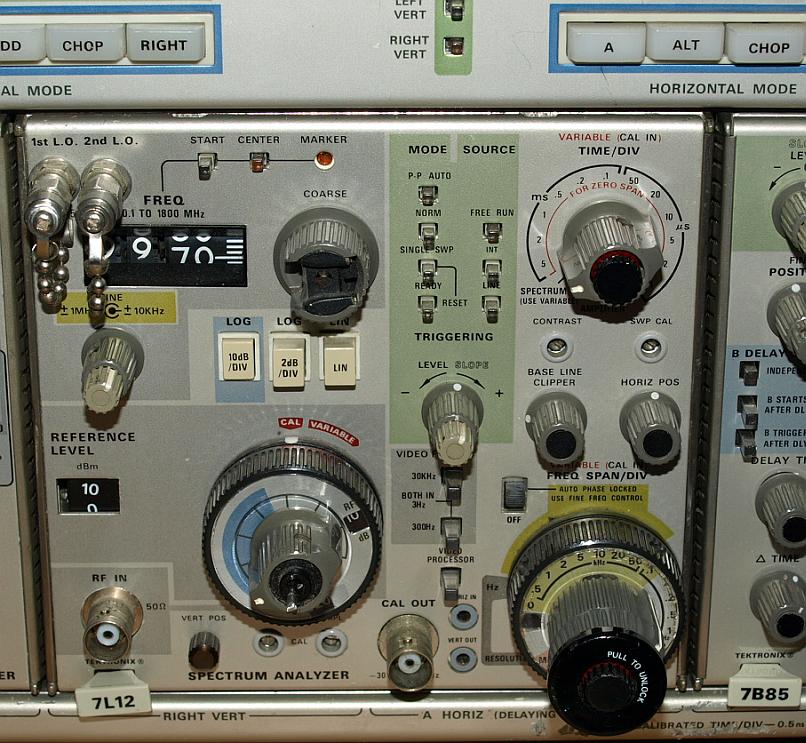
| This is not a comparison for details, I was interested in the quality of the waveforms, if the spectrum on another analyzer also shows so many different frequencies. |
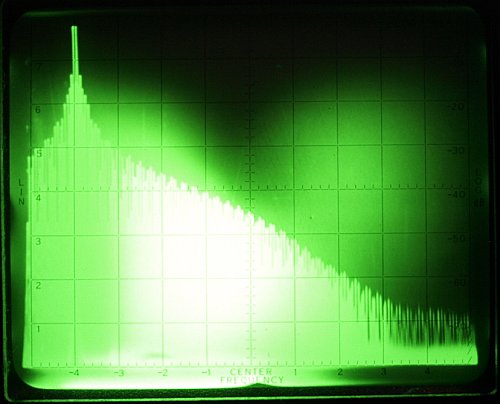
| Three photos of the DAC output with
unknown compensation settings. I haven't noted which photo corrosponds
to which compensation, I was only interested in viewing the
characteristic using a different analyzer. The 141T with its storage CRT and long time/div settings is a good choice for lower frequency DAC signals. With a HF spectrum analyzers it's in general more difficult to view LF signals. The 7L12 covers a maximum 1.8 GHz range, the used Plug-in of the 141T covers a range of maximal 110 MHz (UKW radio), other 141T Plug-in's are available, some wide in the GHz (radar) and one Plug-in for LF signals (audio). |