|
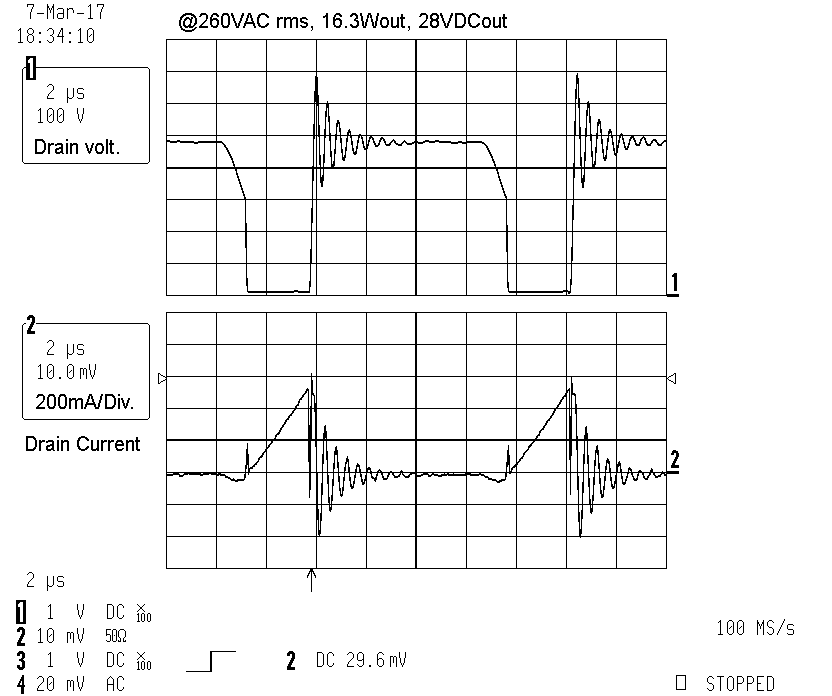
Evaluation Board use TVS350 Clamping Diode. (Current has a measurement error: current probe amplifier terminated
with 50ohm scope input + 50ohm resistor additional on BNC cable, so
real current is a higher)
|
| Primary-Power-Coil
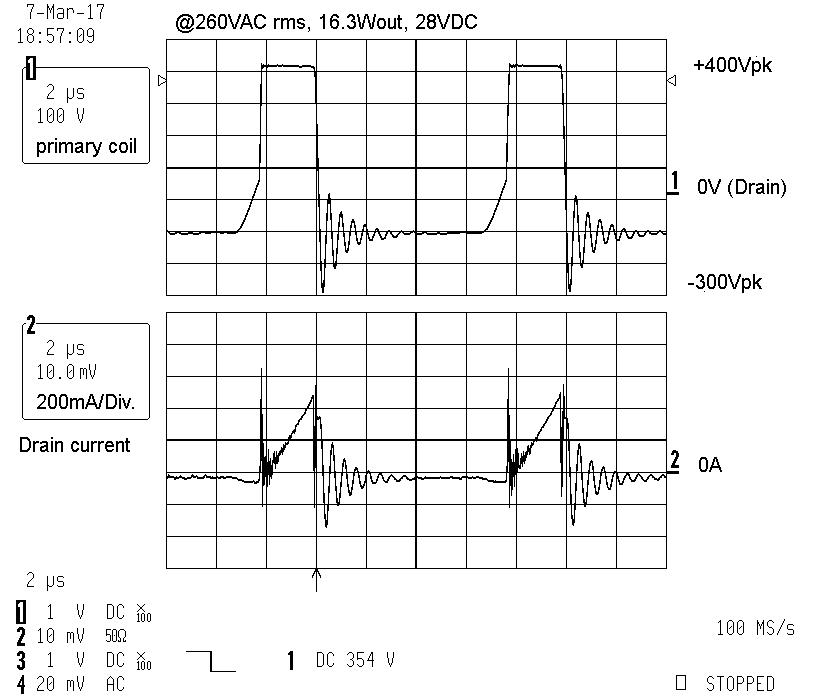
max. voltage +400Vpk/-300Vpk. Drain potential = GND. Transformer isolation must isolate this voltage and
AC waveform, check datasheet. Repeat test outside normal operating conditions, under increased supply voltage. Do these extended test to a time when you are familar with the circuit. Don´t worry about the current peak on beginning of the rising ramp, caused by the 100:1 probe alligator clamp on Drain potential. Drain potential is very dynamic compared to the large surface oscilloscope ground. (Current has a measurement error: current probe amplifier terminated with 50ohm scope input + 50ohm resistor additional on BNC cable, so real current is a higher) |
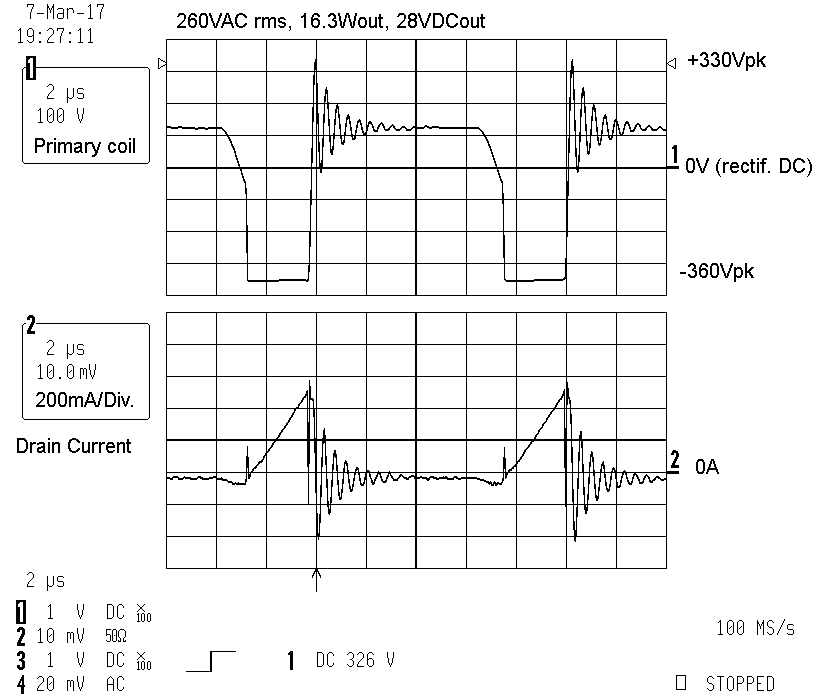
| Same
measurement like in figure 141. The probe alligator clamp connected to the constant
low impedance rectified DC signal. Probe tip connected to
Drain. Current Peak in the beginning of the rising ramp is much lower and looks ok. Drain signal sensitive to capacitive load, part of the LC-tank. (Current has a measurement error: current probe amplifier terminated with 50ohm scope input + 50ohm resistor additional on BNC cable, so real current is a higher) |
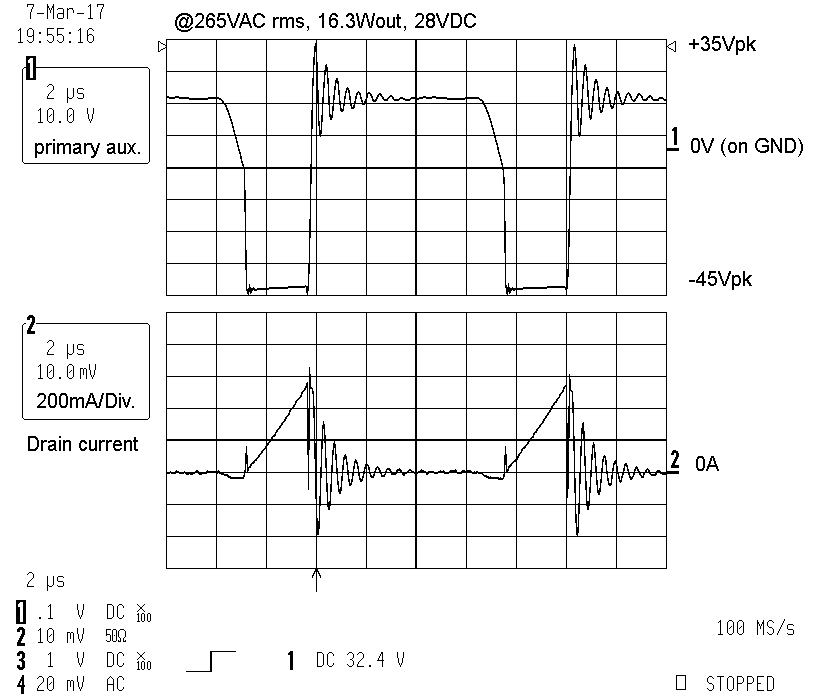
| Voltage
on auxiliary primary coil, supplying the IC
with power and information about the primary power coil
voltage waveform.
Primary auxiliary coil used for feedback regulation of
the secondary side output voltage and finding the correct switching points. Compare voltage waveforms of figure 142 with 143, looking similar - transformer works well. The method of using two coupled primary coils is a advantage of this IC, prevents isolating coupling devices (e.g. optocoupler) between primary and secondary side. Reduce part count, simplifies layout and improve reliablility. (Current has a measurement error: current probe amplifier terminated with 50ohm scope input + 50ohm resistor additional on BNC cable, so real current is a higher.) |
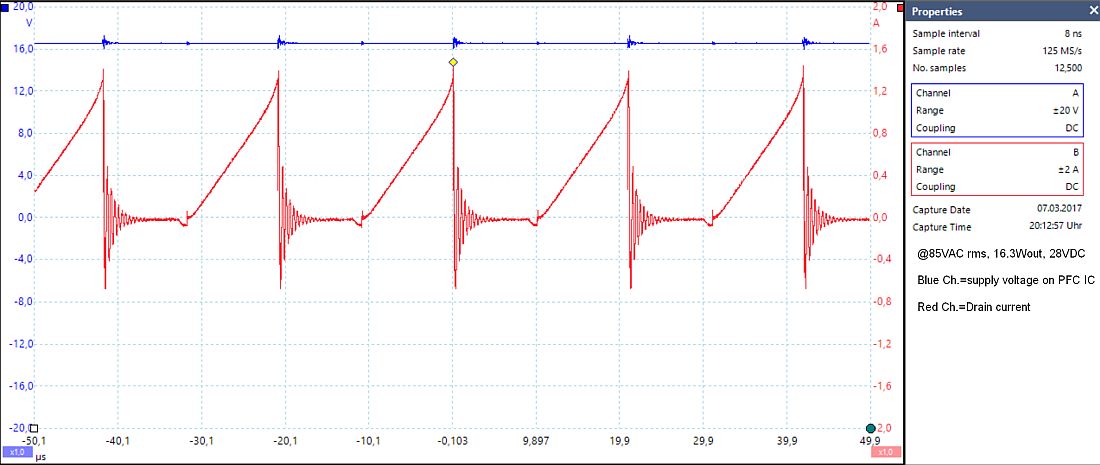
| @85VAC rms, power supply Vcc bypassed by 47µF Electrolytic in parallel with 100nF ceramic. |
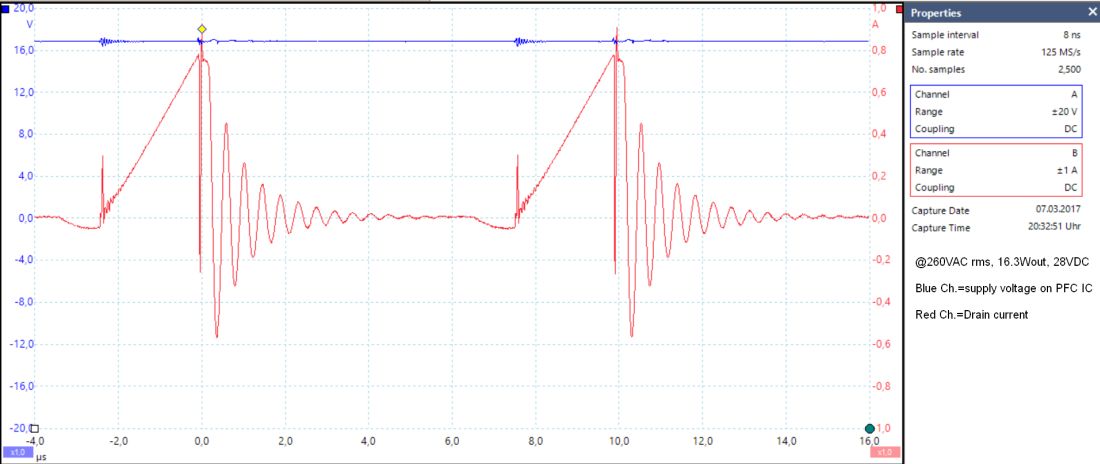
| @260VAC rms, power supply Vcc bypassed by 47µF Electrolytic in parallel with 100nF ceramic. |
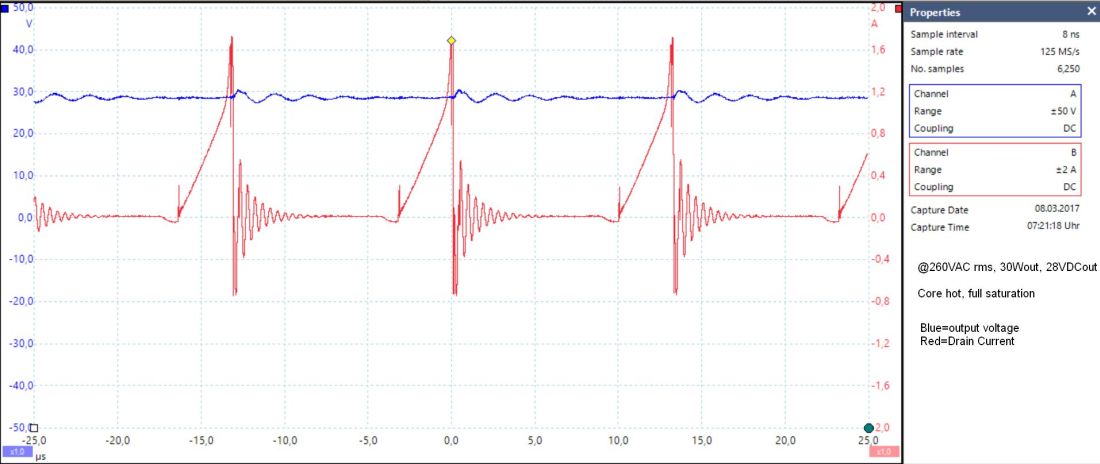
| hot core @260VAC rms, 30W out, 28VDC out Maximum possible output power 30 watt under 265VACrms, current limit 1.7Apk reached.
Core saturated, running warm within 3 minutes. Current ramp very sharp, inductance decreased under high currents.
|
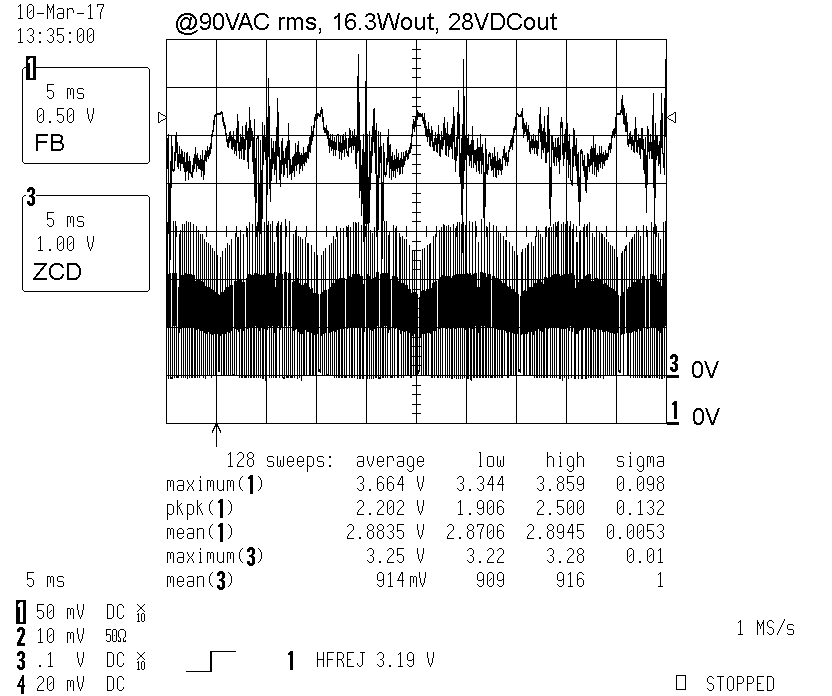
| FB feedback. ZCD, voltage on auxiliary winding. |
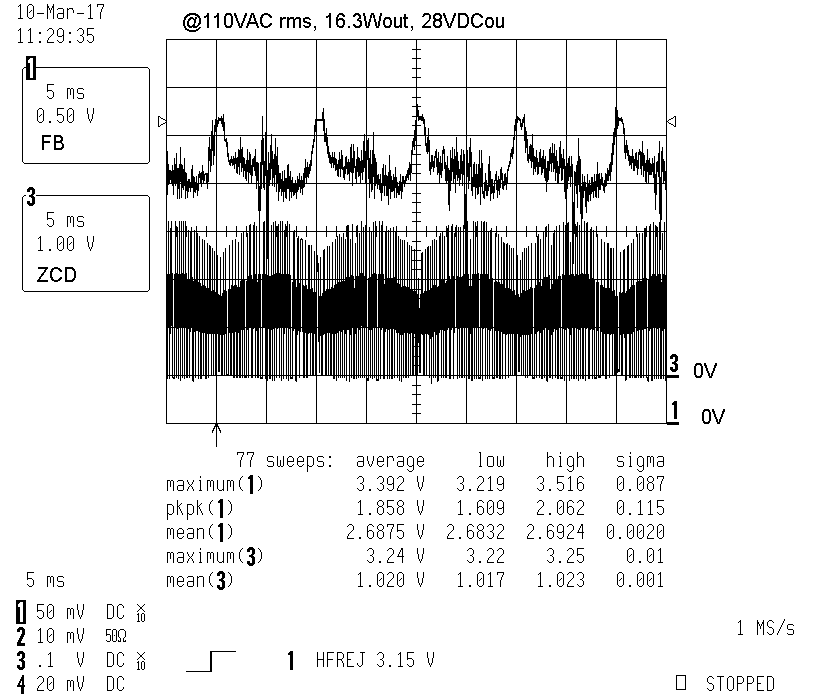
| @110VAC rms, 16.3Wout, 28VDCout |
|
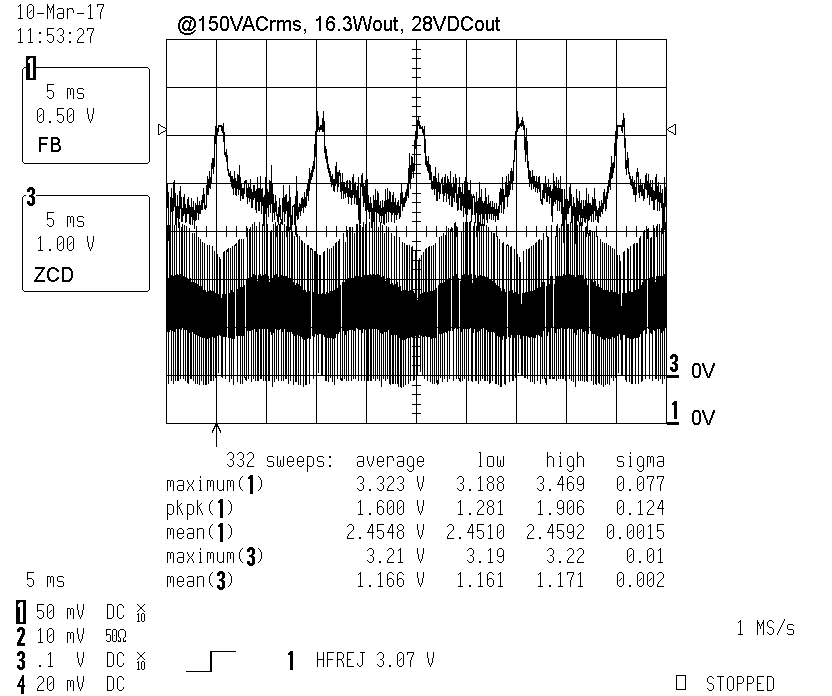
@150VAC rms, 16.3Wout, 28VDCout |
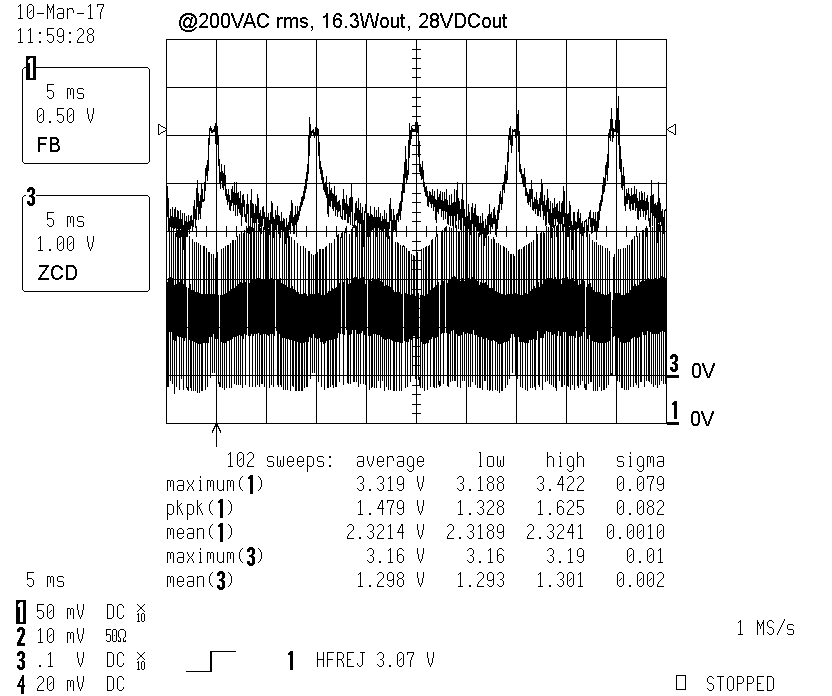
| @200VAC rms, 16.3Wout, 28VDCout |
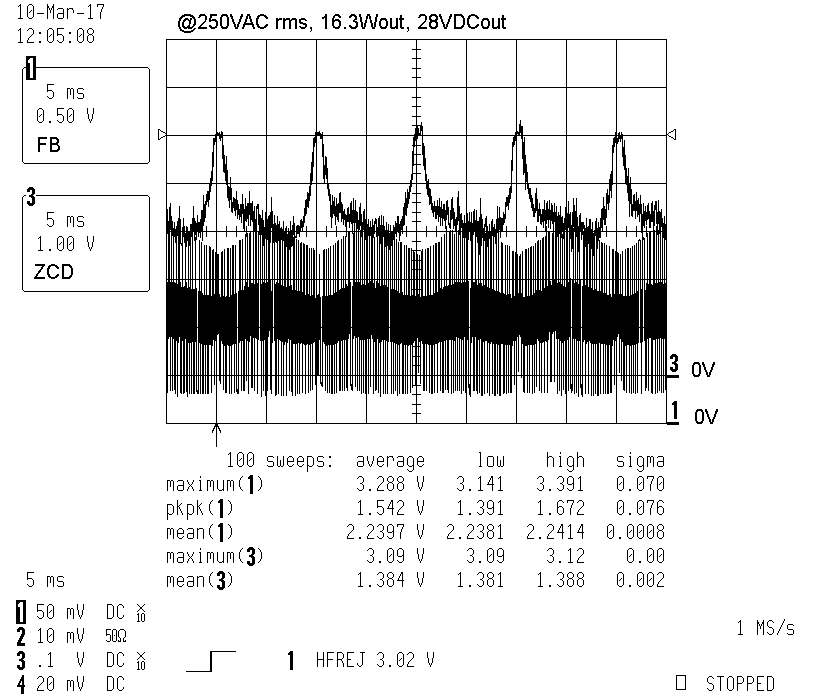
| @250VAC rms, 16.3Wout, 28VDCout |
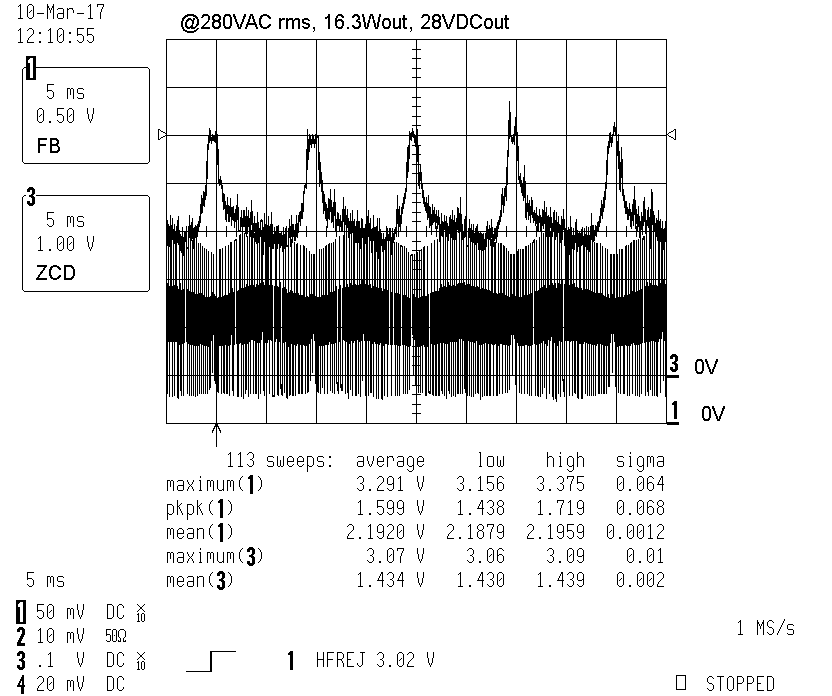
| @280VAC rms, 16.3Wout, 28VDCout |
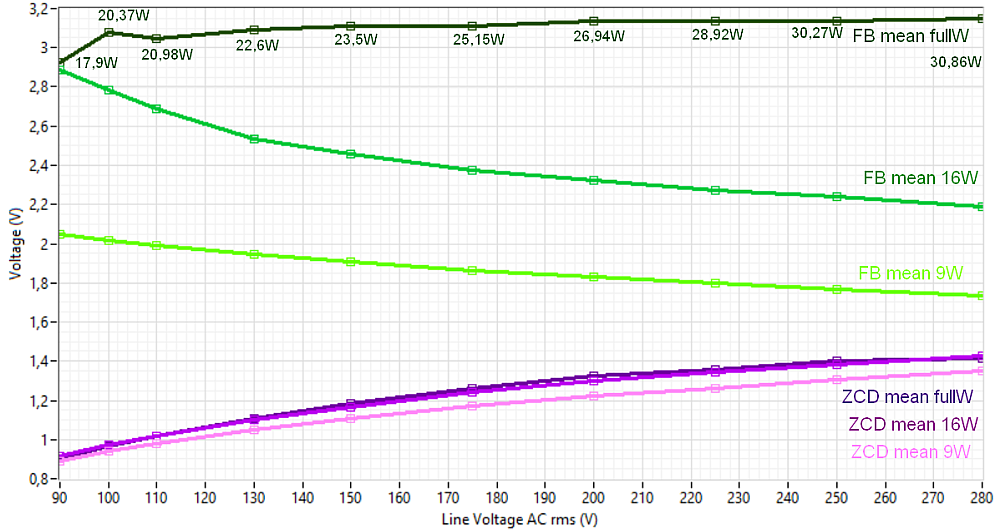
| sweeping from @ 90 - 280VAC rms, @16.3Wout, 28VDC out | ||||||||||
| 90VAC | 100VAC | 110VAC | 130VAC | 150VAC | 175VAC | 200VAC | 225VAC | 250VAC | 280VAC | |
| FB max | 3.664V | 3.471V | 3.392V | 3.347V | 3.323V | 3,310V | 3.319V | 3,297V | 3.288V | 3.291V |
| FB peak | 2.202V | 1.948V | 1.858V | 1.837V | 1.6V | 1,426V | 1.479V | 1,513V | 1.542V | 1.599V |
| FB mean | 2.8835V | 2.7830V | 2.688V | 2.5368V | 2.455V | 2,3744V | 2.321V | 2,2701V | 2.239V | 2.192V |
| ZCD max | 3.25V | 3.25V | 3.24V | 3.22V | 3.21V | 3,19V | 3.16V | 3,12V | 3.09V | 3.07V |
| ZCD mean | 0.914V | 0.971V | 1.02V | 1.098V | 1.166V | 1,242V | 1.298V | 1,346V | 1.384V | 1.43V |
| Purpose of the table, getting a better understanding of Pin behaviour under changing AC voltage |
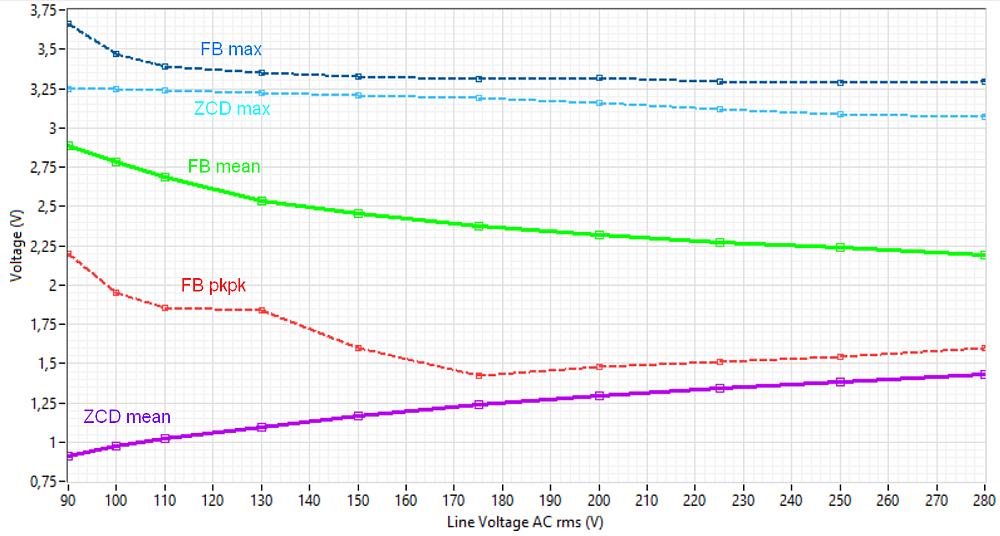
| Constant output power 16.3Wout 28VDC. Only the mean values are useful for a possible circuit. |
| sweeping from @ 90 - 280VAC rms, @9.3Wout, 28.9VDC out | ||||||||||
| 90VAC | 100VAC | 110VAC | 130VAC | 150VAC | 175VAC | 200VAC | 225VAC | 250VAC | 280VAC | |
| FB max | 3.124V | 3.085V | 3.075V | 3.088V | 3.072V | 3.059V | 3.027V | 3.038V | 3.003V | 3.007V |
| FB peak | 1.498V | 1.502V | 1.527V | 1.6V | 1.635V | 1.675V | 1.68V | 1.727V | 1.723V | 1.754V |
| FB mean | 2.056V | 2.016V | 1.9908V | 1.9447V | 1.9043V | 1.8646V | 1.8282V | 1.7957V | 1.7654V | 1.73626V |
| ZCD max | 3.00V | 2.97V | 2.97V | 2.93V | 2.91V | 2.88V | 2.86V | 2.85V | 2.87V | 2.91V |
| ZCD mean | 0.892V | 0.940V | 0.981V | 1.051V | 1.11V | 1.173V | 1.222V | 1.263V | 1.303V | 1.349V |
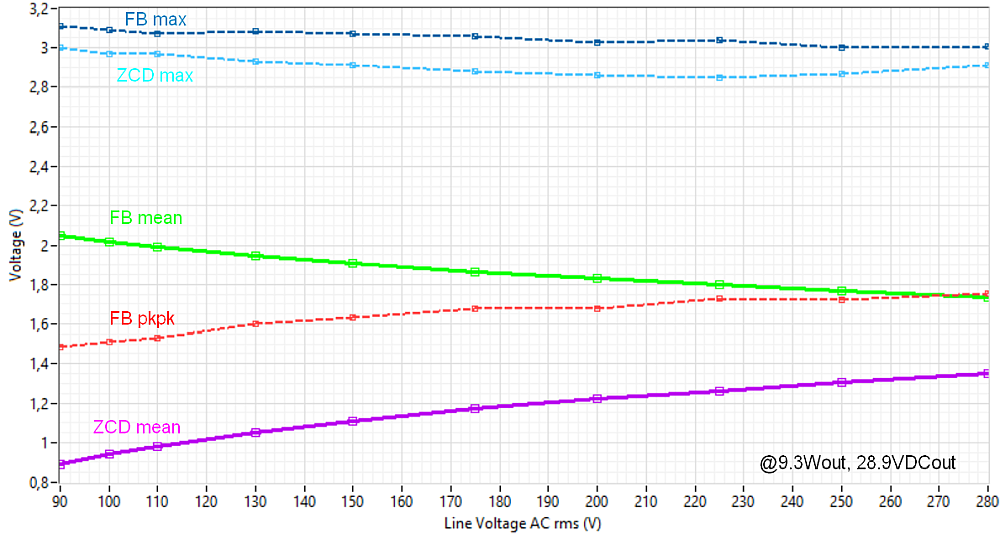
| Constant output power 9.3Wout 28.9VDC |
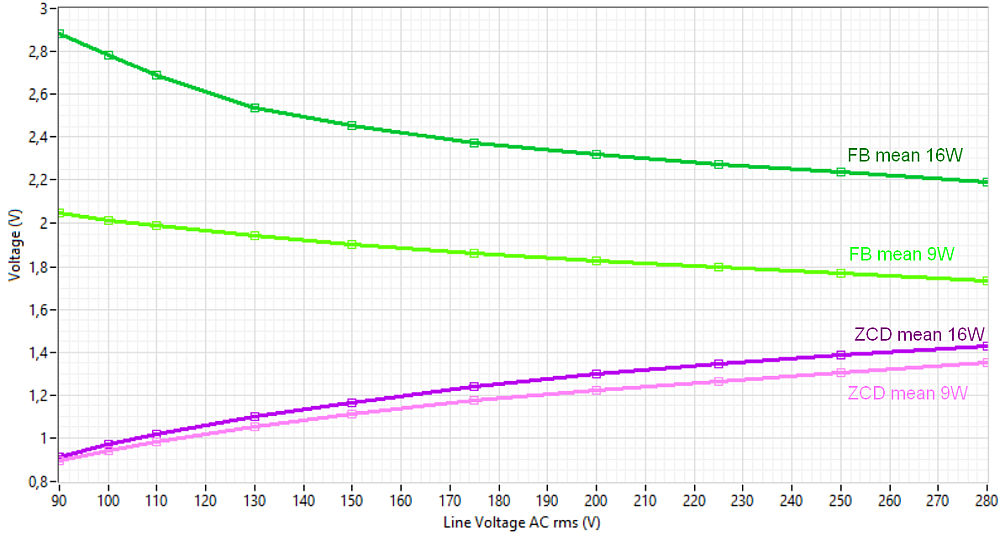
| 9.3Wout and 16.3Wout in the same diagram |
| sweeping from @ 90 - 280VAC rms, @Pmax. Wout at Switch-OFF, 28VDC out | ||||||||||
| 90VAC | 100VAC | 110VAC | 130VAC | 150VAC | 175VAC | 200VAC | 225VAC | 250VAC | 280VAC | |
| FB max | 3,749V | 3,381V | 3,360V | 3,430V | 3,475V | 3,503V | 3,571V | 3,539V | 3,553V | 3,567V |
| FB peak | 2,208V | 1,326V | 1,338V | 1,397V | 1,453V | 1,524V | 1,628V | 1,581V | 1,618V | 1,669V |
| FB mean | 2,9255V | 3,0778V | 3,0477V | 3,0901V | 3,1111V | 3,1104V | 3,1380V | 3,1336V | 3,1383V | 3,1495V |
| ZCD max | 3,25V | 3,23V | 3,25V | 3,25V | 3,25V | 3,25V | 3,26V | 3,21V | 3,22V | 3,14V |
| ZCD mean | 0,905V | 0,969V | 1,018V | 1,106V | 1,181V | 1,262V | 1,325V | 1,356V | 1,4V | 1,412V |
| P max. | 17,9W | 20,37W | 20,98W | 22,06W | 23,5W | 25,15W | 26,94W | 28,92W | 30,27W | 30,86W |
| Load R | 44,7 Ohm | 39,6 Ohm | 37,9 Ohm | 35,8 Ohm | 33,6 Ohm | 31,4 Ohm | 29,1 Ohm | 27,1 Ohm | 25,9 Ohm | 25,4 Ohm |
| VDC out | 28,3VDC | 28,4VDC | 28,2VDC | 28,1VDC | 28,1VDC | 28,1VDC | 28,0VDC | 28,0VDC | 28,0VDC | 28,0VDC |
| Core PT1000 | 1181 Ohm | 1185 Ohm | 1182 Ohm | 1189 Ohm | 1201 Ohm | 1235 Ohm | 1241 Ohm | 1236 Ohm | 1235 Ohm | 1240 Ohm |
| Temp | 47,01°C | 48,05°C | 47,27°C | 49,09°C | 52,02°C | 61,04°C | 62,59°C | 61,39°C | 61,04°C | 62,33°C |
| Over load condition under all AC-line-voltages |
| Over load condition under all AC-line-voltages. Under these
power levels controller stops switching. After cooling down transformer
core, controller starts automatically. Controller manage core
saturation very safe. |
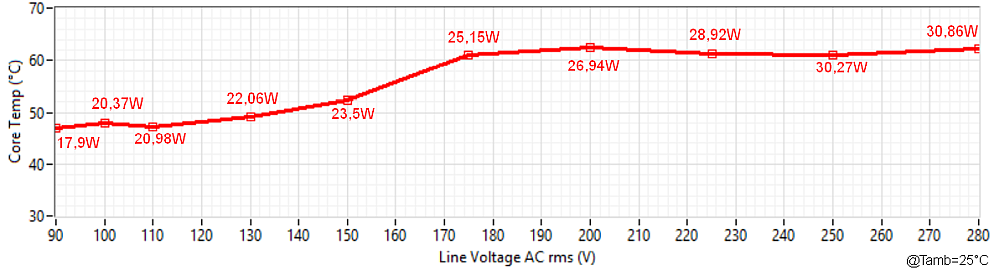
| Highest core temperature under permanent max. overload condition. Overload Condition means,
operating with the lowest possible load resistance close to
the Peak-Current-Switch-Off. Under Overload Condition the core
becomes saturated, additional test under max. operating temperature recommended.
It was not possible to reach a higher core temperature than approx.
63°C
Controller manage core saturation absolute safe, no damaged parts. Evaluation Board works fine. |
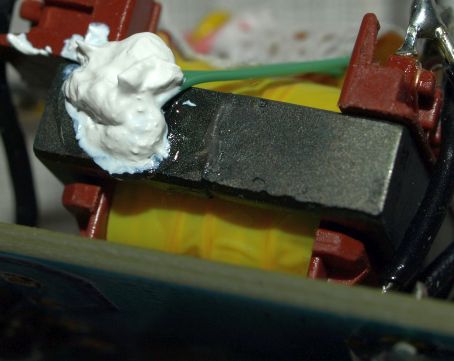
| Measurement of the core temperature. PT1000 glued on the
core. Covered with thermal heat-grease for a better thermal integration
of the sensor. Main error source, convection on the small green
wires. It is recommended keep wires close to the core.
Best measurement would be a sensor under the windings or more inside the core. Therefore the shown measurement can have 10-15°C measurement error compared to the inner core region. Compare measurement with a thermal camera or other methods. In this experiment it is not necessary to measure the max. temperature value with high precision, here the temperature amplitude vs. AC-voltage was a matter of interest. |
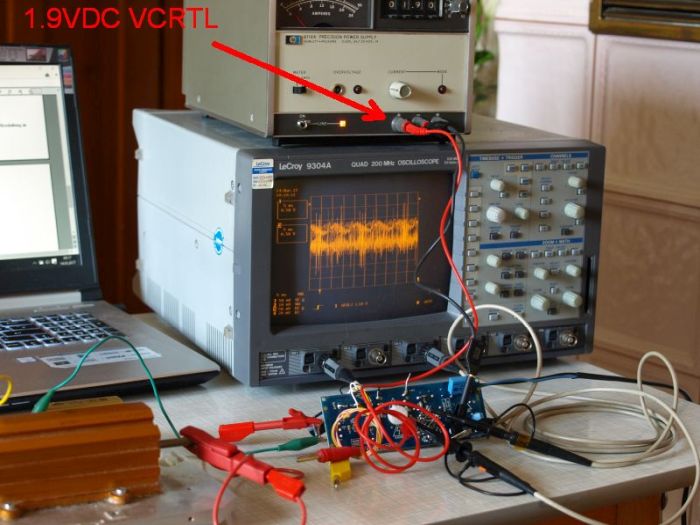
| DC-supply on Control Pin, noisy scope plot |
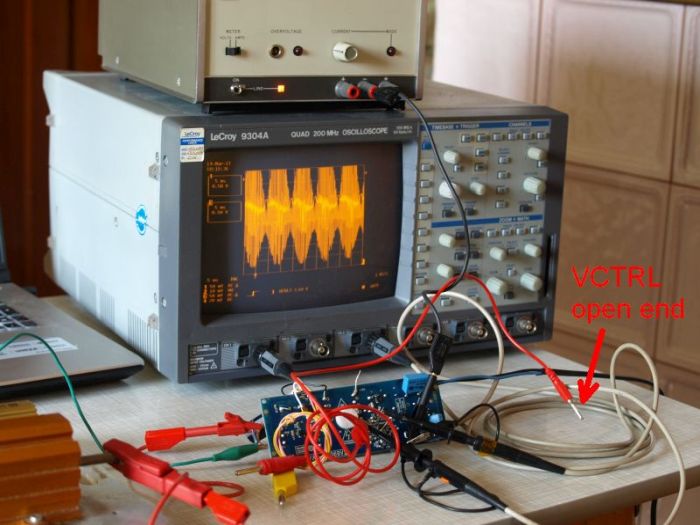
| Pin has high impedance, collects all noise under open end wire |
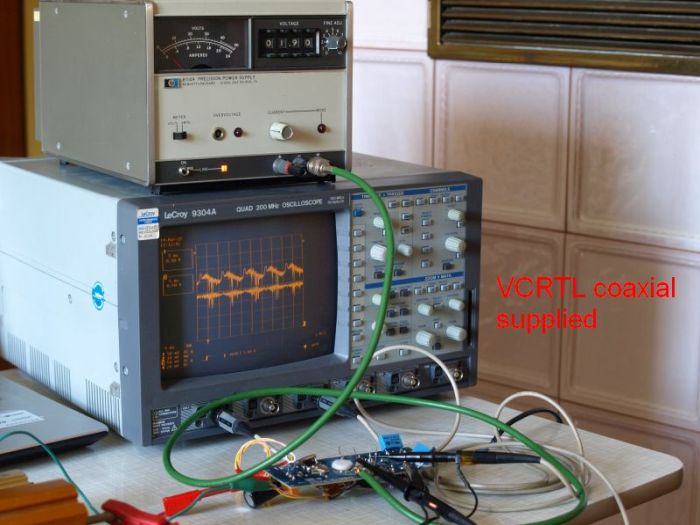
|
Measurement requires shielded coaxial cable.
|
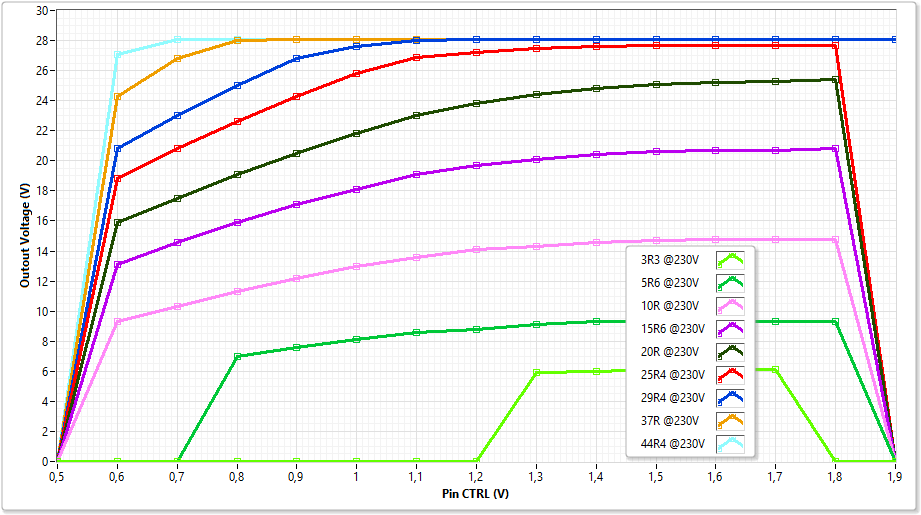
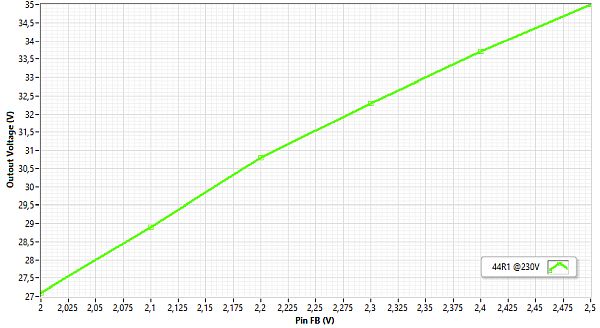
| It is possible to control output power via an external voltage, transfer function is nonlinear. Function not required, no further investigations done to implement a control circuit - end of experiment. |
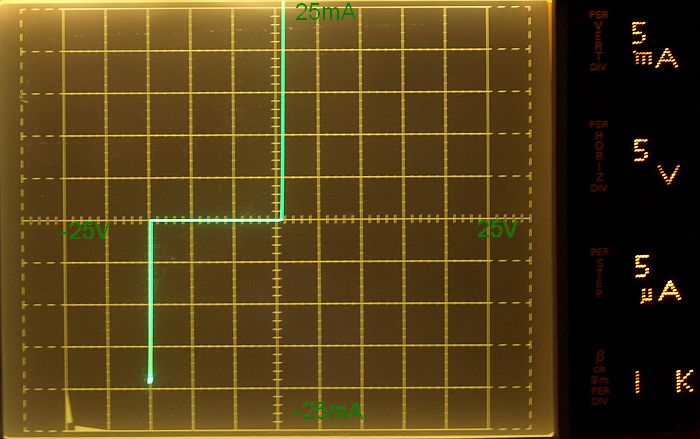
| Current vs. Voltage curve of a working 15V zener diode |
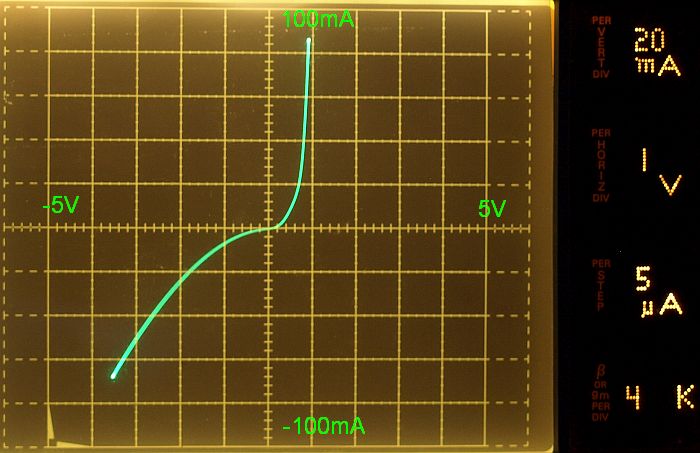
| Current
vs. Voltage curve of the damaged 16V zenerdiode. In forward direction
curve looks ok, in reverse direction curve failed, compare with figure
166. In reverse direction failed diode behaves like a non-linear
resistor, not like a zener. Approx. R = -15V/-52mA ==> 288 Ohm Don´t throw away such parts (but mark it). If you ever need for any experiment a non-linear resistor (1 quadrant only), use it. The question will be how stable remain this curve? This failed zener curve was another good example for the need of special test equipment. No labority is complete without a curve-tracer, a highly recommended instrument. Without such instruments it is more difficult to find failed parts, e.g. a DMM with a simple diode function tester would show an intact diode in forward direction !! the reverse direction the DMM would detect the failure. But what happen if the user test only the zener forward direction with the DMM?, because user knows the DMM will not show a result for a 16V zener in reverse direction, no reverse test done. User would think this diode works correct and can be resoldered back on the PCB:Such a scenario of undetectable errors (lack of test equipment, lack of experience, wrong assumptions), can made a user sick, e.g. wasting many hours searching for others (non-existing) errors, changing many parts on the PCB hoping always this was the fault - no success - the fault was already resoldered back on PCB by the user itself. At the end of the day, he will throw away the PCB and use a new PCB. This is sometimes a fast way, but not the way of understanding things and needs. |
| This was the experiment, external applied voltage on FB. Controller destroyed under experiments by user mistake. Evaluation Board works again after renewing controller and zener diode. |
 .
.